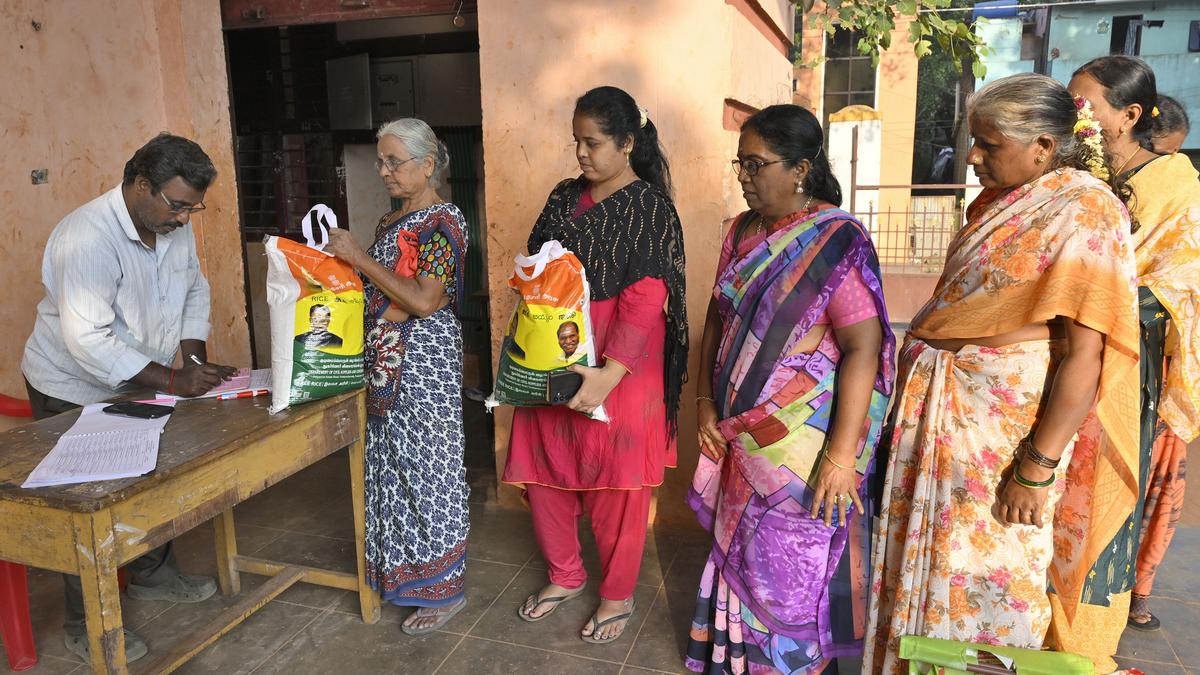

The reduction in consumption inequality implies that the poorer segments have benefited more from social welfare programmes
| Photo Credit:
KUMAR SS
The World Bank Poverty and Equity Brief published in April 2025 shows that India has reduced poverty significantly in the last decade. Using the ‘Extreme Poverty Line’ of $2.15 or lower per day, India’s poverty rate declined from 16.2 per cent in 2011-12 to 2.3 per cent in 2022-23. Using the poverty line for Lower Middle Income Countries (LMICs), which is $3.65 per day or lower, India’s poverty rate declined from 61.8 per cent to 28.1 per cent during the same period.
For their estimates, the World Bank has used the Consumption Expenditure Survey (CES) for 2011-12 and the Household Consumption Expenditure Survey (HCES) for 2022-23. The HCES is a new annual survey and its results are not directly comparable to those of the previous CESs by the NSSO. This is due to significant methodological changes to the questionnaire, sample design, data collection type, and household stratification. The World Bank report acknowledges these issues but still reports the numbers with the possible assumption that macro level trends are still comparable.
Traditional schemes
A closer look at the HCESs 2022-23 and 2023-24 shows that one possible factor behind the impressive poverty reduction can be the consumption support provided through various social welfare schemes. These traditionally include the PDS, different livelihood support schemes, and pension and financial inclusion schemes. But over the past decade, Central and State governments have pursued several direct benefit transfer (DBT) schemes. Under these, free food and non-food are provided for the population. These not only help consumption smoothing but also free up some money for other types of consumption.
Like the previous CES surveys, the HCES estimates the monthly per capita consumption expenditure (MPCE) of rural and urban households in India. However, as a new feature, the HCES also estimates a second set of consumption expenditures, which considers imputed values of free items distributed by the government. The value of these items has been imputed by identifying the unit price at which the beneficiary household would have bought the same if it was not received for free. Looking at the MPCE numbers, with and without imputed values, gives us an idea of the impact these DBTs have on consumption patterns.
The Table shows rural and urban MPCE at current prices from HCESs 2022-23 and 2023-24. We looked at MPCE values with and without imputation. There is a significant difference between rural and urban MPCE when no imputation is used. The urban MPCE is around 70 per cent higher than the rural MPCE in this scenario. However, there is a slight narrowing of the gap between rural and urban MPCEs in 2023-24.
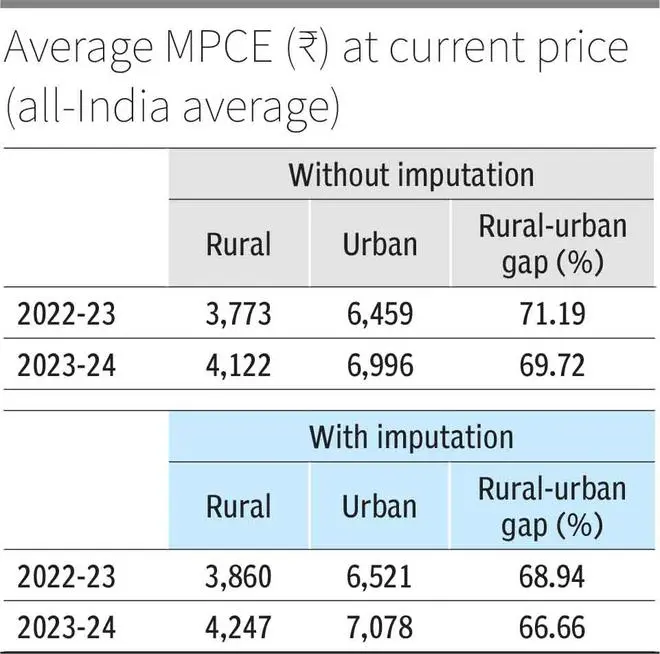
When MPCE with imputed values is considered, it shows that rural consumption increased more than urban in both years, narrowing the gap between rural and urban consumption. Secondly, the extent of transfer is not very high, though it is increasing. For 2022-23 and 2023-24, the per-person transfer for the rural sector was ₹87 and ₹125, respectively. Assuming a family size of five, this amounts to a per household transfer of ₹435 and ₹625. The average transfer for the urban sector was lower. However, these seemingly small transfers have reduced the Gini coefficient for the rural sector from 0.237 in 2022-23 to 0.230 in 2023-24. The Gini dropped from 0.284 to 0.279 for the urban sector during the same period. The reduction in consumption inequality implies that the poorer segments have benefited more from these social welfare programmes.
Cereal intake
If we look at the impact of social welfare schemes on product groups, the most significant has been on cereal consumption in the rural sector. Without imputation, the average MPCE on cereals and cereal substitutes is ₹206 in rural India in 2023-24. That figure becomes ₹323 with imputation, indicating an increase of almost 57 per cent. For the urban sector, the increase is 29 per cent. The increases in other categories are much lower. There is some increase in the MPCE on clothing and durable goods, presumably because free school uniforms and laptops/bicycles are provided in certain States. But the overall impact of these transfers is much lower. The MPCE in rural India on clothing went up by 1.8 per cent, whereas the MPCE on durable goods increased by 0.75 per cent in rural India. The corresponding figures for the urban sector are much lower.
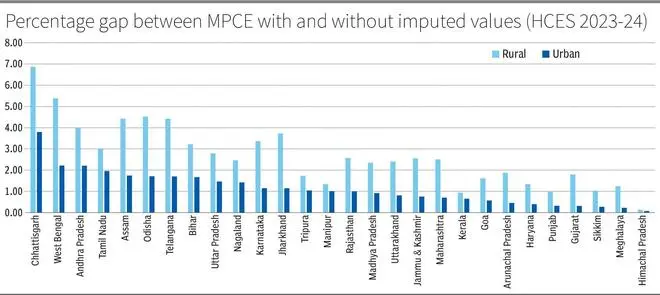
State-wise data show that the impact of government transfers has improved consumption in all the major States. However, there are State-wide variations in the extent of social transfers. For example, in Telangana and Andhra Pradesh, the gap between MPCE with and without imputation is ₹240 and ₹212, respectively, for the rural sector. The corresponding amounts for Punjab and Kerala are only ₹24 and ₹51. Chhattisgarh and Tamil Nadu have the highest figures for the urban sector, whereas Gujarat and Punjab are at the bottom. If we look at the percentage increase in consumption due to these schemes, for the rural sector, the maximum gain in consumption has happened in Chhattisgarh (6.86 per cent), West Bengal (5.39) and Odisha (4.53). In the urban sector, Chhattisgarh (3.80), West Bengal (2.22) and Andhra Pradesh (2.21) are the top three beneficiaries (see Chart).
Overall, the introduction of MPCE figures with and without imputed values in HCES allows us to analyse the reasons behind sharp poverty reduction in India. It shows that the DBTs have been small in nominal terms, but they seem to have significantly affected the consumption of food items, especially cereals in the rural population. There is also a reduction in the rural-urban consumption gap. These preliminary findings suggest that social transfers have contributed to consumption smoothening among the poorer population and helped in poverty reduction.
The writers are with the IIM Calcutta
Published on May 22, 2025